The apiUi GUI
The Ui in the name apiUi is, as you might guess, an abbreviation for User interface.
apiUi has a graphical user interface that is beyond compare, at least among other mocking/stubbing tools.
Moreover, the GUI is very fast, also with large messages.
This document describes the apiUi user interface based on the picture below.
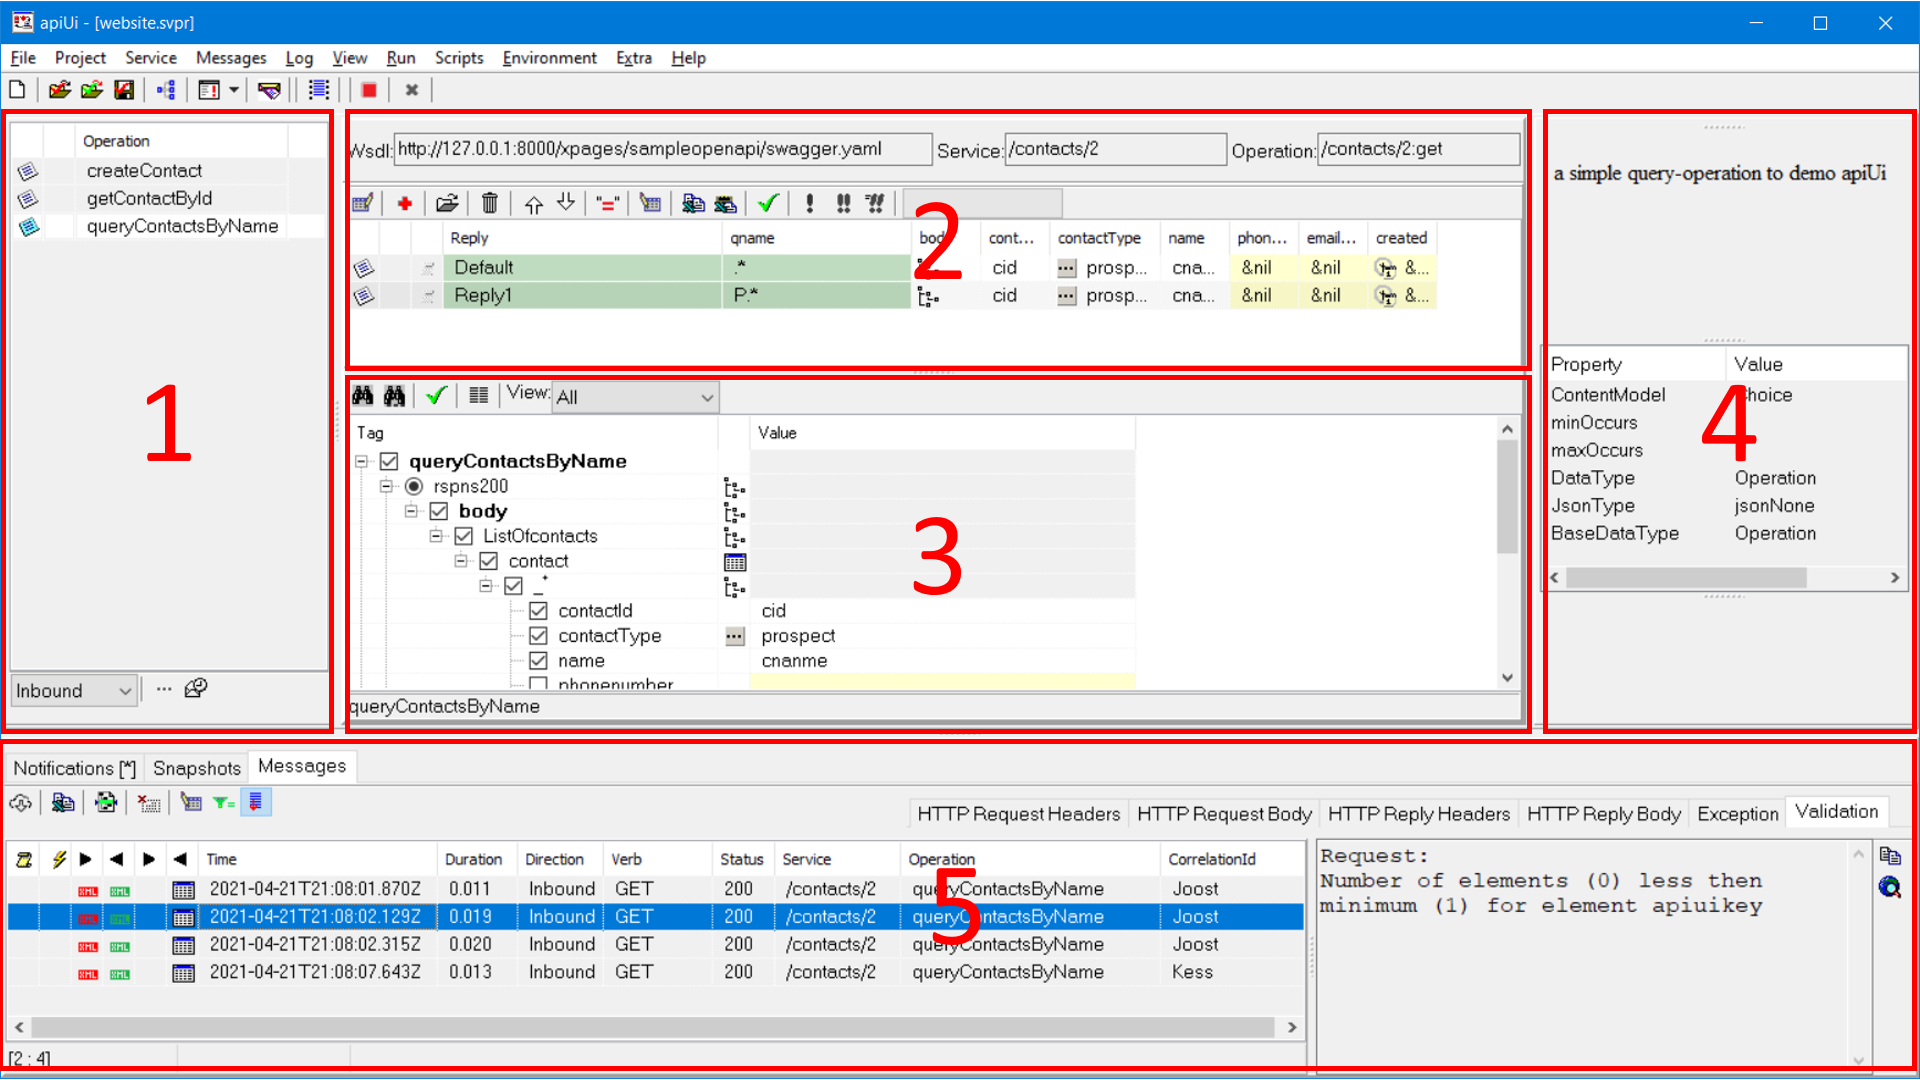
1 Operations
A list of all operations that were found on introspecting the Wsdl and Api files you have added to your project.
Select an operation and the messages grid, the message tree-view and the schema information will show data belonging to the selected operation.
The context menu
Right-click on an operation to open the context menu for that operation.
More information on the Operations context menu
Operation options
One of the items of the context menu leads to the operation options.
More information on the Operation Options
2 Messages grid
A list of all message-candidates for the selected operation, probably the most important panel during test design.
Here you do configure correlation and here it is possible to copy to or from a spreadsheet program.
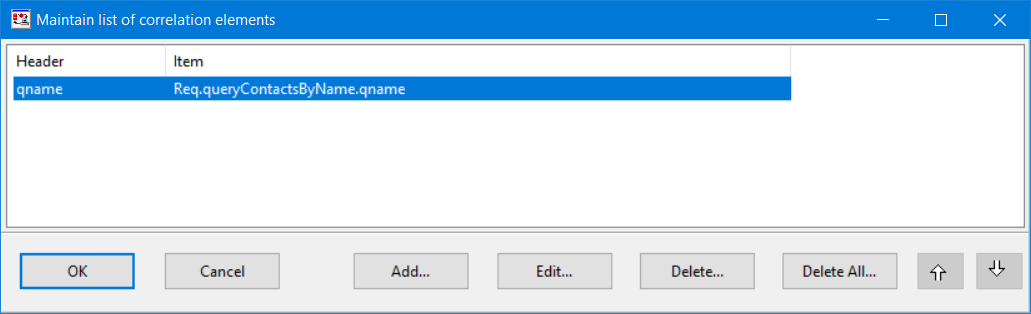
How to configure correlation
To configure correlation, choose menu item Messages->Select correlation elements and
apiUi will present a screen to edit a list of elements.
After having specified the correlation elements, the messages grid will have extra columns, one for each correlation element. Add a message by clicking on the plus-icon and your screen will look like below.
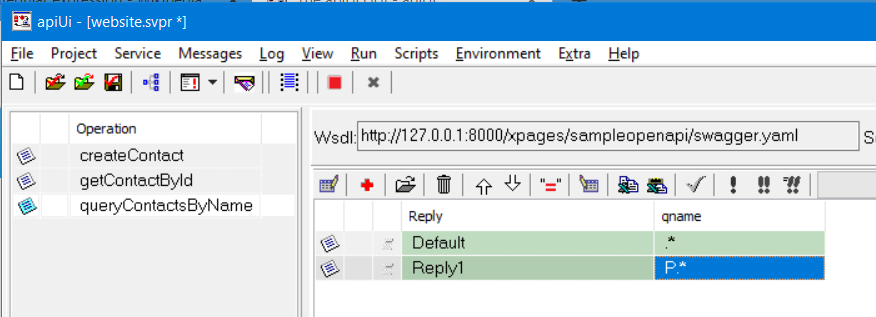
In correlation columns (in this example the column qname) you can enter regular expressions.
It is not possible to change the regular expression for the first row because that is the default response. This row will be used if no other row matches.
Displayed columns
By adding displayed columns this panel will change into the one that gives you most insight.
To add columns use the menu option Messages->Select column elements.
Edit the list of displayed columns in the same way as editing correlation items works.
With displayed columns you can also select a group. apiUi will then prompt you whether or not to expand the group.
When you do not expand, apiUi will add one column with a tree-view icon.
When you do expand the group, apiUi will add a column for each element within the selected group.
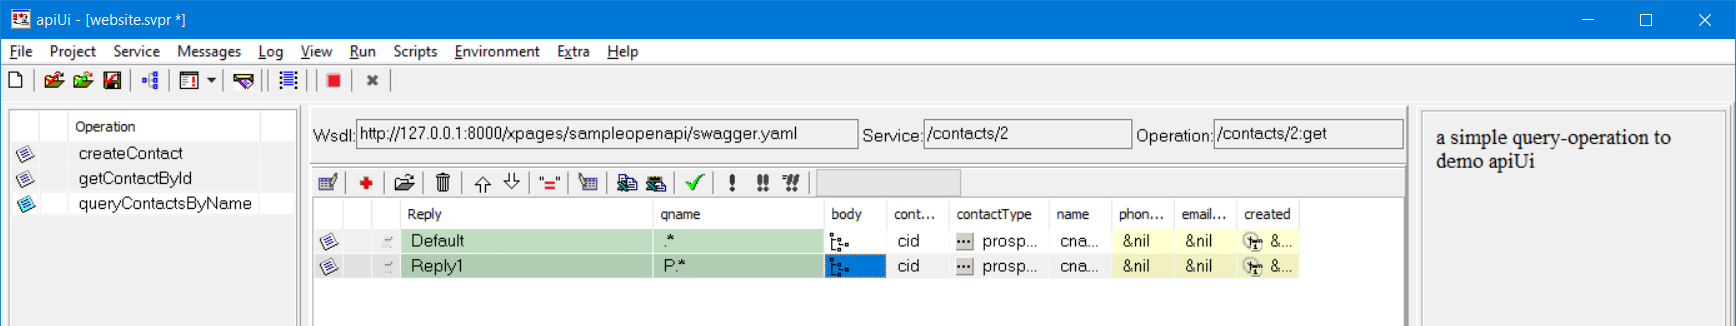
The picture below shows how your screen will look like if you select the reply body twice, the first time choose to not expand and the second time to do expand.
Pressing on the tree-view icon will show the tree-view for the groupelement, clicking the other icons will pop-up a helper depending on the datatype.
The yellow cells showing &nil are cells that are not part of the message because the element itself or another element in it's up-line is not checked.
Change data in a cell and you can immediately also see the change in the message-tree-view below. Select multiple cells in a column to change these values at once.
Note: It is only possible to address the first item of a repeating group.
Copy to and from a spreadsheet
Having chosen displayed columns opens a very fast way to add rows to your stub. Copy current data by choosing Messages->Copy grid, then switch to your preferred spreadsheet program and paste the data there. In that spreadsheet program change and add rows as you like but do not change, add or remove columns. Once you are satisfied, copy all data from your spreadsheet, switch back to apiUi and paste by Messages->Paste grid.
Note: Some spreadsheets require that you first select 'text' as format for all cells to avoid unsolicited changes.
3 Message tree-view
A structured view on the selected message candidate.
This is typically the place where all data-entry can be done (in the messages grid you can only edit first occurrences).
The colors in the tree-view
Gray:
A gray cell in the value column means that the selected element is a group. In the tools column you will see a tree-view icon that, when clicked, will pop-up a screen with the downline of the selected group.
Yellow:
A yellow cell means that the element, although it may show a value, is not part of the message. This is because either the cell itself or a cell in it's up-line is not checked. Changing data in such a cell will cause the whole up-lineto get checked.
Bold:
Bold elements are elements that are mandatory in their group.
Bold red:
When the parent of a mandatory element is part of the message but the element itself is not, then its name will be shown in bold red.
Green:
The background for names belonging to requests is green as it is white for names for response elements. For operations in Outbound mode the request is shown first,
for operations in Inbound mode the response is shown first. Data entry only makes sense in the first shown part, the second part is there for reference.
Data entry
When you select an element apiUi will show technical and descriptive information at the right side. That data comes from the formal description of the service (wsdl / api / cobol copy book) and is used by apiUi for ease of data entry. Click on the value to change/enter data. Based on the schema information apiUi will show icons in the middle column that will, when clicked, pop-up a screen for data-entry. This enables you to easily enter data in the correct format. If entered data is not valid according the schema, apiUi will show a warning but you may want to leave this data as entered to test how your system under test behaves with erroneous data.
The context menu
Using the context menu you can copy/paste data, populate elements without typing, collapse and expand elements and much more. Read here to find out all details.
4 Schema information
During data-entry apiUi will show information from the schema what will help to enter correct data.
At the top you will see the description from the schema on operation level.
In the middle of this panel, technical data for the selected element is shown and the last part shows the schema description for this same element.
5 Logging
Where previous described panels show important data on design-time, this panel shows data on run-time. This panel has three tabs, Notifications, Snapshots and Messages, each with their own set of speed-buttons.
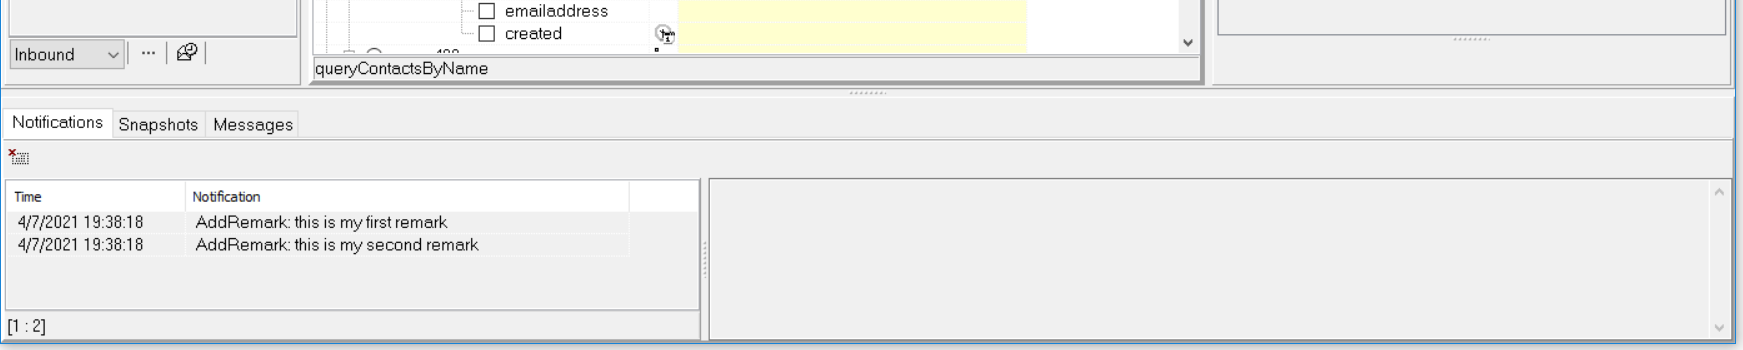
Notifications
During opening of projects and during introspection of formal contracts, apiUi may give notice of something. Such notifications become visible in this tab. Besides notifications, this tab will also shows remarks from user-scripts. If the caption of the notifications tab shows an asterix, then new notifications were added to the list since last time the content of this tab was shown.
Snapshots
An apiUi snapshot contains a set of saved log lines. A snapshot can later be restored for debugging and can be promoted to reference to become base for the apiUi automatic regression testing. When you create a snapshot it will contain the currently available log lines that were not yet saved to an earlier snapshot.
Snapshots are created from script by the createsnapshot function or via a call to apiUi's own api.
A more detailed describtion can be found here.
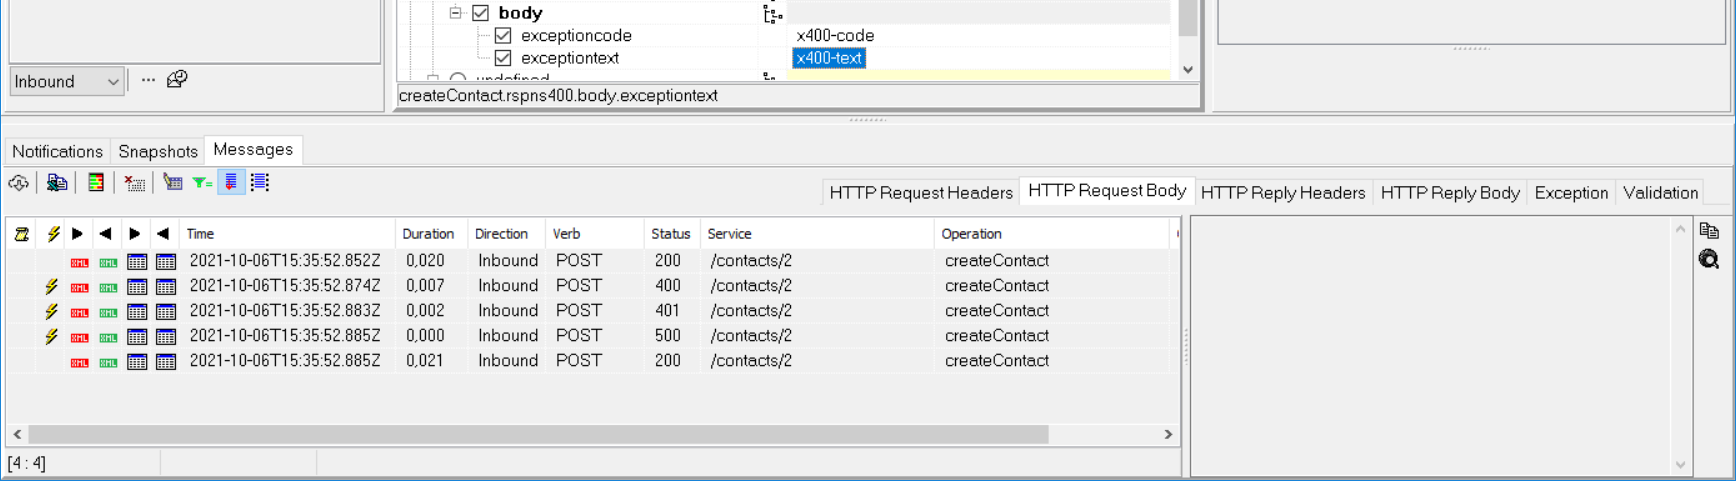
Messages
Each inbound and outbound call will get an entry in this list. When you select a log line, the textpane at the right will show information from the selected line depending on the chosen tab. At the left, clicking on these buttons will show request (left button) or response (right button) data in a structured way
, a tree-view or a grid. The colors of the tree-view buttons have a meaning. apiUi can do schema validation. When these buttons are gray
, no validation has been done, green means validation has been done and the message validated ok, red means that at least one violation was found during
the schema-validation. You can switch schema-validation on or off on project level by changing project options and, if needed you can overrule that setting for specific operations in the operation context menu.
the apiUi Log-messages Tool Buttons
- Log messages from remote server
- Copy log entries (Spreadsheet format)
- View coverage report
- Clear all log items
- Displayed columns
- Set filter on log
- Scroll new messages into view
- Change project log settings
1 Log messages from remote server
Only enabled when you have set an apiUi remote server connection.
Use this function to fetch messages from an instance of apiUi running remotely.
Fetched messages will be removed from the log in the remote server.
2 Copy log entries (Spreadsheet format)
Copies the log entries in a format that can be pasted in a spreadsheet.
All fixed columns such as Time, Duration, Direction and also the customised displayed columns will be copied.
3 View coverage report
Show a report that shows which parts of requests and repsonses are covered and which parts not yet.
More information
4 Clear all log items
Pressing this button will remove all log-entries from apiUi.
5 Displayed columns
Will show a dialog in which you can specify a list of column headers.
Which data will be displayed in a column depends on the logged message.
Specifying which data to display is done in the log panel self, click in the cell and select the desired item. Repeat this for each distinct opration (obviously not possible before such a message is logged at least once).
6 Set filter on log
Shows a dialog to filter log-entries.
You can also choose to highlight instead of filtering.
This function only works for apiUi in the current session.
Filtering does impact reporting.
The color of this button has a meaning:
green:
No filter active
blue:
A filter is active, result is shown by highlighting entries.
red:
A filter is active which may hide log-entries.
7 Scroll new messages into view
Toggle button.
In case enabled, apiUi will make sure that new log-entries are visible as soon as they arive.
8 Change project log settings
Lets you change project options with regard to logging.
More information about these options can be found here.